Introduction
When the government of Trinidad and Tobago (TnT) executed consecutive preventative detention orders (PDOs) in 2025, they decreased violent crime in the short term, but, after about 5 weeks of PDOs, the effect of additional PDOs appears to diminish. This is the key takeaway from my preliminary analysis.
Statistical Model Review
The Regression Equation
Recall from the last few posts that the dataset includes the following variables: the number of violent crimes committed, \(Y_{i,t}\), the number of PDOs executed with lags for \(j\) weeks, \(X'_{i,t}\), and the number of PDOs executed in neighbouring regions with lags for \(j\) weeks, \(S'_{i,t}\). The regression equation for the statistical model is:
\[\begin{align*} \text{log}(E[Y_{i,t}|X,S]) = &\beta'_1 X'_{i,t} + \beta'_2 S'_{i,t} \\ &+ \alpha_i + \lambda_t \end{align*}\]
There have been a few changes to this statistical model. Firstly, assuming \(t\) spans a week, then it is very possible that all the crime captured by \(Y_{i,t}\) happened in the first half of the week, whereas the PDOs were all executed in the latter half of the week. If the model is used as is, then I would be using future data to predict past data, which is wrong. For this reason, I will not include values of \(X_{i,t}\) or \(S_{i,t}\) for the period being analysed. Instead, I will only include lags.The regression equation, which I will henceforth refer to as the "discrete equation," is now
\[\begin{align*} \text{log}(E[Y_{i,t}|X,S]) = &\beta'_1 X'_{i,t-1} + \beta'_2 S'_{i,t-1} \\ &+ \alpha_i + \lambda_t \end{align*}\]
Secondly, the current statistical model predicts the effect of a PDO at discrete units of time. That is, the model tells us how a PDO executed exactly 3 weeks ago affects crime today. This model doesn’t tell us how PDOs executed consecutively throughout the 3 weeks affect violent crime today. This is a subtle but important difference about discrete vs cumulative impacts. To account for this second variation, I introduce another regression equation that no longer includes raw lags in the model (except the \(j\)th lag), but that instead includes the difference between subsequent lags up to the \(j\)th lag. Where \(A'_{t}\) is a list of \(j\) lags starting from period \(t\), \(A^d_t\) is the difference in \(j\) subsequent lags.
\[\begin{align*} A^d_t = &(A_t - A_{t-1}, A_{t-1} - A_{t-2},\\ & …, A_{t-j+1} - A_{t-j}, A_{t-j}) \end{align*}\]
The coefficient associated with the difference in lags for the previous \(k\)th and \((k+1)\)th period will indicate the effect on violent crime if a PDO was executed in each of the past k periods. For example, in a model that uses week-long periods, the coefficient associated with \(X_{i,t-3} - X_{i,t-4}\) will indicate how violent crime today would be affected if a PDO was executed in each of the past 3 weeks. The regression equation, which I will henceforth refer to as the "cumulative equation" is now:
\[\begin{align*} \text{log}(E[Y_{i,t}|X,S]) = &\beta'_1 X^d_{i,t-1} + \beta'_2 S^d_{i,t-1} \\ &+ \alpha_i + \lambda_t \end{align*}\]
Model Specifications
Though the regression equation will be kept consistent, the model will be specified in 24 different ways throughout this preliminary analysis. These 24 different specifications are a result of there being two interval periods (4 days and 1 week), three levels of analysis for the geographic subdivisions (~11km2, ~30.4km2, and ~121.6km2), two ways of defining "violent" crime (precisely and imprecisely), and 2 numbers of lags (4 and 8). Review part 3 of the series to understand why these different specifications are being used to ensure rigour.
Expectations
Before I can analyse the data, I must outline what I would expect to see if the causal model / network disruption theory were true.
- The execution of a preventative detention order causes a decrease in violent crime.
- That decrease in violent crime is temporary.
- Effects are less significant at higher levels of aggregation (temporally, geographically, and with imprecise vs precise violent crime).
- The effect of PDOs in neighbouring communities is unknown.
Preliminary Findings
I begin by analysing the results of the models that use the cumulative equation.
PDOs Negatively Affect Violent Crime
Overwhelmingly, the cumulative models predict that if PDOs are executed consecutively in a community, over multiple periods, then violent crime will decrease within that community. Across 23 of the 24 model specifications, the final cumulative effect of these consecutive PDOs on violent crime is negative, and the majority of these results are statistically significant.
Table 1
Cumulative Effects of Consecutive PDOs, across 4 and 8 periods of execution| Geographic Area | Time Period | Violence Spec | Cumulative Effect After 4 Periods (\(\beta_1\)) | Cumulative Effect After 8 Periods (\(\beta_1\)) | |
|---|---|---|---|---|---|
| 4-Lag Model | 8-Lag Model | ||||
| 11km2 | 4 days | Precise | -1.55 (-79%) *** | -1.52 (-78%) *** | -2.12 (-88%) *** |
| Imprecise | -1.01 (-64%) ** | -0.96 (-62%) ** | -1.51 (-77%) * | ||
| 7 days | Precise | -0.90 (-59%) ** | -0.92 (-60%) * | -0.88 (-59%) * | |
| Imprecise | -0.71 (-51%) | -0.78 (-54%) | -0.79 (-55%) * | ||
| 30.4km2 | 4 days | Precise | -0.67 (-49%) * | -0.77 (-54%) | -1.44 (-76%) ** |
| Imprecise | -0.41 (-34%) | -0.46 (-37%) | -0.64 (-47%) | ||
| 7 days | Precise | -0.51 (-40%) *** | -0.56 (-43%) * | -0.61 (-46%) *** | |
| Imprecise | -0.26 (-23%) * | -0.35 (-30%) | -0.43 (-35%) *** | ||
| 121.6km2 | 4 days | Precise | -0.22 (-20%) ** | -0.24 (-21%) *** | -0.60 (-45%) *** |
| Imprecise | -0.14 (-13%) | -0.13 (-12%) | -0.21 (-19%) | ||
| 7 days | Precise | -0.18 (-16%) | -0.14 (-13%)* | -0.15 (-14%) | |
| Imprecise | -0.09 (-9%) | -0.06 (-6%) | 0.02 (2%) | ||
Cumulative Effect of PDOs are Statistically Significant
As expected, cumulative effects are less statistically significant at higher levels of aggregation with regard to geographic subdivisions and with how "violent crime" is defined. Of the models that use 121.6km2 grid cells, 6 of 8 of the final cumulative effects are insignificant, whereas of the models that use 30.4km2 grid cells, 2 of 8 of the final cumulative effects are insignificant. In line with this finding, of the models that use 11km2 grid cells, only 1 of 8 of them are insignificant. Similarly, when models used precise definitions of violent crime, only 2 of 12 of them were statistically insignificant, whereas, when models used imprecise definitions of violent crime 7 of 12 of them were statistically insignificant. Notably, the amount of models that were statistically significant using 4-day long time intervals is the same as those that use week-long intervals.
If I only consider the results from models that use 30.4km2 or 11km2 grid cells and that use the precise definition of violent crime, all the results are statistically significant at the 95% confidence level, three quarters of them are significant at the 99% level, and half are significant at the 99.9% level.
The Cumulative Effect of Consecutive PDOs Appear to Diminish Over Time
To visualize how cumulative PDOs affect local violent crime observe the following graphs. These graphs plot the cumulative effect of consecutive PDOs (\(\beta_1\)) at each period and are drawn from the models that use 8-lags and precise data. The top graph shows models that use 4-day long periods whereas the lower graph shows models that use 7-day long periods.
Using the lower graph, I can say that if a PDO was executed last week in an 11km2 grid cell, then violent crime today should decrease by 35%, whereas if a PDO was executed last week and in the week before it, violent crime should decrease by 46%.
As shown in both graphs, the larger the geographic area under consideration, the less a PDO decreases local violent crime. This is clear because the line for 11km2 is consistently below the line for 30.4km2, which is consistently below the line for 121.6km2.
Additionally, the cumulative effect of consecutive PDOs on violent crime appears diminish over time. The effect peaks 35 days after the first PDO was executed, after which the effect decreases towards 0 (though it doesn't yet hit zero in my analysis). Though inconclusive, this suggests that after 5 weeks of executing PDOs in a community, executing more PDOs may be worthless.
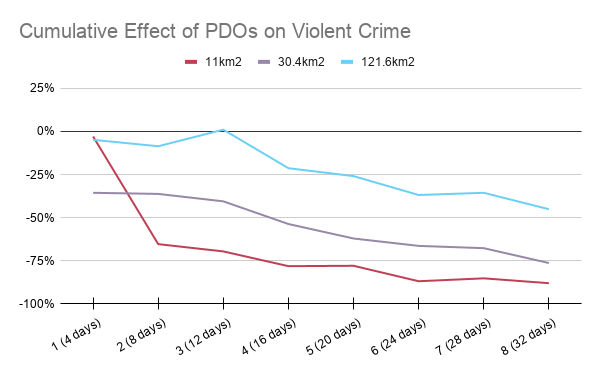
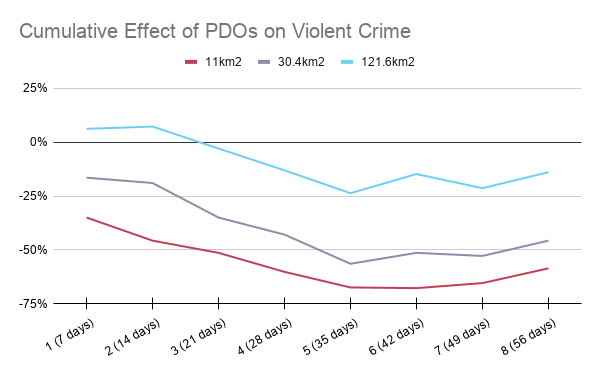
It is tempting to suggest that the PDOs executed after week 5 cause violent crime to increase, but this conclusion cannot be made with certainty. Though I've observed that the cumulative effect of consecutive PDOs begins decreasing towards 0 after week 5, this may be due to the tendency for things to revert to the mean. Additionally, when analysing the results of the 24 specifications of the model using the discrete equation, though the coefficients for the first few lags of \(X_{i,t}\) are frequently negative and the last few lags are more likely to be positive, none of these lags are reliably significant. This means that my statistical model is not sufficient to estimate the discrete effect of individual PDOs at specific points in the future.
Violent Crimes Prevented
To investigate this further, I estimate how much violent crime the government of TnT prevented by executing PDOs in 2025. The regression equation in exponential form is:
\[E[Y_{i,t}|X,S] = e^{\beta'_1 X^d_{i,t-1} + \beta'_2 S^d_{i,t-1} + \alpha_i + \lambda_t}\]
From this equation, \(e^{\alpha_i + \lambda_t}\) corresponds to the violent crime that would have occurred if no PDOs were executed.
\[e^{\alpha_i + \lambda_t} = \frac{E[Y_{i,t}|X,S]}{e^{\beta'_1 X^d_{i,t-1}} \times e^{\beta'_2 S^d_{i,t-1}}}\]
Therefore the amount of violent crime prevented by executing PDOs is \(e^{\alpha_i + \lambda_t} - E[Y_{i,t}|X,S]\). Confidence intervals for these figures will be calculated using parametric bootstrapping. An estimate of these values is given below using 8 lags and precise definitions of "violent crime." Note that the models using 4-day long periods and 8 lags give insight into the effects over a 32 day period (shorter horizon), whereas the models using 7-day long periods and 8 lags give insight into the effects over a 56 day period (longer horizon).
Table 2
Estimates of the Violent Crime Prevented throughout 2025, through the use of consecutive PDOs| Geographic Area | Time Period | Violent Crime Prevented | Confidence Interval | Violent Crime Recorded | ||
|---|---|---|---|---|---|---|
| 2.5% | 50% | 97.5% | ||||
| 11km2 | 4 days | 27 | 15 | 42 | 120 | 583 |
| 7 days | -5 | -10 | 6 | 179 | 525 | |
| 30.4km2 | 4 days | 30 | 4 | 44 | 128 | 583 |
| 7 days | -7 | -26 | 4 | 50 | 525 | |
| 121.6km2 | 4 days | 24 | -22 | 32 | 132 | 583 |
| 7 days | -22 | -61 | -14 | 61 | 525 | |
As shown by the table above, the models that use short periods, such as 4 days, predict that PDOs decreased crime. When a longer view is taken, however, such as with the models that use 7 day periods, the results are statistically insignificant from zero. In the long run, I cannot say conclusively that the execution of a PDO reduces violent crime, even if it appears to in the short run. Note that there is slight variation in the violent crime recorded depending on the length of the periods used. Since a year is not exactly divisible into 4 or 7 day periods, at least a few days (and thus crimes) must be dropped from each model. Additionally, though I only list estimates generated from models that use the "cumulative equation," note that the findings were very similar for models using the "discrete equation."
The Effect of Spillover is Minimal and Inconclusive
Generally spillover was not found to be statistically significant. In only about half of all of the models was \(S_{i,t}\) found to be significant at the 1st lag. Notably, in all of the cases where it was statistically significant, its coefficient was positive at the 95% level. Though inconclusive, this suggests some sort of displacement effect. When a PDO is executed, free criminal actors may move from that area into neighbouring communities, causing an uptick in violence.
Robustness Checks
Two things could invalidate these results: reverse causality and autocorrelation.
Reverse Causality
If the government of TnT executed PDOs in areas where they observed violent crime rising, then this model would be invalidated. PDOs would not cause some change in violent crime as we’ve found, but instead violent crime would cause some change in PDOs. To test for this I introduce leads into \(X^d_{i,t}\) and \(S^d_{i,t}\). If these leads are found to be significant in predicting \(Y_{i,t}\) then that is evidence that reverse causality is affecting my statistical model.
I specified 12 models using precise definitions of "violence". In 3 of these models, one of the leads for \(X_{i,t}\) were significant, and in 1 of these models, one of the leads for \(Y_{i,t}\) was significant. In other words, 8 out of 12 of the models found none of the leads to be significant. Again, in other words, 44 out of the 48 leads across the 12 model specifications were found to be insignificant. Though it is not conclusive, this is an indication that reverse causality is not an issue.
Autocorrelation
In part 2 of the series I said that I would use Conley spatial HAC standard errors to account for autocorrelation both spatially and temporally. However, I could not find a software package (prewritten tool) that would allow me to account for temporal autocorrelation while using a PPML statistical model. I was able to account for spatial autocorrelation by setting the radius in which I expect there to be autocorrelation. Since gangs are expected to be community based, for the same reason that I only measure spillover using crime that occurred in the directly neighbouring regions, I set my radius of spatial autocorrelation to only cover the neighbouring regions.
Though I do not directly handle temporal autocorrelation, I do not expect it to be a significant issue. I justify this by regressing violent crime against lagged values of itself. If the lagged values are a positive and statistically significant predictor of the current figure, then that indicates temporal autocorrelation, presenting an issue. However, after running the regressions, the lagged value of violent crime is rarely significant and when it is, it negatively predicts violent crime in the present period. This means that violent crime in any specific geographic subdivision is a rare event, and combined with the lack of reverse causality, temporal autocorrelation is not an issue.
Still, it is possible that the Conley spatial HAC standard errors do not accurately account for autocorrelation. As another quick robustness check, I re-estimated the models (with precise data and 8-lags) using two supplemental variance estimates: clustering only on the grid cell, and on the grid cell and time period. The results remain robust as, though some variables lose significance, the final cumulative effects that were previously significant, remain significant at that 95% level.
Conclusion
When I first began this series, I theorized that "When the government of Trinidad and Tobago (TnT) declares a state of emergency to combat gangs, … it is swinging a hammer at a sponge. They only succeed in compressing the problem, which then rebounds." It seems, at least for now, that my gut was pointing me in the right direction.
When the government of Trinidad and Tobago (TnT) executed consecutive preventative detention orders (PDOs) in 2025, they decreased violent crime in the short term, but, after about 5 weeks of PDOs, the effect of additional PDOs appears to diminish. When criminal actors are removed from their networks, violent crime decreases where they’re from.
The long term effect of these PDOs, however, is unclear. In fact, it appears that with a long enough horizon, the execution of a PDO may be statistically insignificant from 0. Though the results are nowhere near conclusive, this is concerning because it would suggest that cummulative PDOs reduce the occurence of violent crime below the average before raising it above the average, so that the effect is null. Further research is required.
If cummulative PDOs simply displace when and where crimes happen, as suggested by the inconclusive long term effects and inconclusive spillover effects, then the use of PDOs as a policy is called into question. Even if this displacement isn't the case, the short-term models predict that ~27 violent crimes were prevented. Is 27 violent crimes (a roughly 5% reduction) enough to justify the more than 150 detentions that occured? Recall that the precise definition of violent crime spans “murder”, “attempted murder,” “shooting,” and “armed robbery," and that the detainees have no reliable way to challenge their detention.
This is not a conclusive statement about the effect of states of emergency (SOEs) in TnT, but rather it is a preliminary statement about how PDOs executed under these SOEs affect violent crime. Despite the 24 different model specifications used to ensure rigour, much more work needs to be done. Firstly, only the CHS dataset was used in this analysis, due to its spatial-temporal precision, and not the TTPS dataset. As the TTPS dataset aggregates to police divisions and monthly time periods however, it may not provide meaningful insights. As shown already, statistical significance decreases with higher levels of aggregation. On the other hand, the TTPS dataset, though it has its own biases, will not suffer from biases in media coverage as the CHS dataset likely does. Lastly, this analysis only covered the year 2025. At least three times as many PDOs have been executed in 2026 as compared to 2025, so extending the analysis will provide a wealth of information.
Executing this project has been a long process, and I have learned a lot from it. Another step in this process remains: getting feedback from others. If you are reading this, thank you very much for doing so. I hope that you've found my work thought provoking enough to have something to say about it, whether positive or negative. I look forward to it.
Appendix
More Analyses
Pictures
- All diagrams are drawn by me.